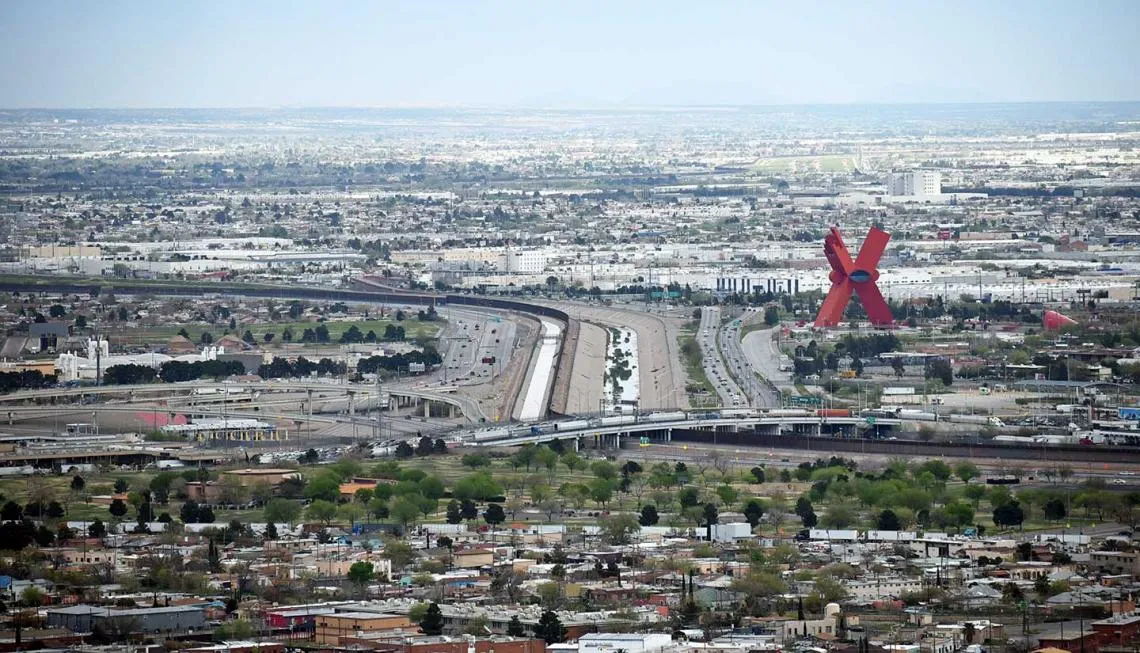
The “Mystery” at the El Paso Port
New Ysleta port complicates analysis of El Paso trade flows

New Ysleta port complicates analysis of El Paso trade flows
Many analysts of the U.S.-Mexico trade who follow cross-border flows of merchandise through the major ports of entry were caught by surprise when data for 2020 revealed a drastic drop at the El Paso port. Could it be that the COVID pandemic affected the El Paso region more than the rest of the U.S.-Mexico border? Since the beginning of the 21st century, the Santa Teresa port (located in New Mexico, but part of the El Paso District), was continuously gaining in cross-border traffic and trade, most of which was overflow from the congested El Paso port. Yet even when figures for these two ports were combined, it still did not explain El Paso’s unusually deep drop during the pandemic and slow post-pandemic recovery.
The announcement of the Customs and Border Protection (CBP) about the Ysleta Bridge being designated a separate and distinct port[1] did not receive much attention from the public. The Ysleta port is located at the Ysleta-Zaragoza international bridge on the east side of El Paso. The bridge has been in existence since the late 1930s, and until recently, border crossings were included in the data for the El Paso port. The latest improvements were implemented in response to increased shipments to and from a large number of maquiladoras that have grown on the east side of Ciudad Juarez, El Paso’s twin city across the border.[2]
Since its opening in March 2020, the Ysleta port has shown astonishing growth in both imports and exports surpassing both the El Paso and Santa Teresa ports, as shown in Figure 1 (exports) and Figure 2 (imports).[3]
Figure 1. U.S. Exports to Mexico via El Paso, Ysleta, and Santa Teresa Ports of Entry, 2010-2020, $ Millions
Figure 2. U.S. Imports from Mexico via El Paso, Ysleta, and Santa Teresa Ports of Entry, 2010-2022, $ Millions
In the next two figures (Figure 3 and 4), trade through the Ysleta port is combined with the El Paso port, and thus visually reflects the fact that a considerable volume of cross-border flows was redirected within the once single gateway area rather than being “lost.”
Figure 3. Combined U.S. Exports to Mexico via El Paso and Ysleta, 2010-2022, $ Millions
Figure 4. Combined U.S. Imports from Mexico via El Paso and Ysleta, 2010-2022, $ Millions
How does the emergence of the Ysleta port affect the relative positioning of Nogales, Arizona’s major port? Table 1 shows that a decade ago, the Nogales port held third place among the western ports of entry in US exports to Mexico, after El Paso and Otay Mesa. Since its opening in 2020, the Ysleta port jumped to third place and together with stronger growth at the Santa Teresa port, caused the Nogales port to slide to fifth place. By 2022, the Ysleta port became the largest port for U.S. exports to Mexico in the western portion of the U.S.-Mexico border. The Nogales port remained in fifth place.
Table 1. The Rank of Major Western Ports of Entry Based on U.S. Exports to Mexico, $ Millions
Table2. The Rank of Major Western Ports of Entry Based on U.S. Imports from Mexico, $ Millions
[1] “CBP re-aligns Texas ports of El Paso and Ysleta on March 20, 2020,” https://www.livingstoneint.com, Feb 28,20220.
[2] “Major expansion of Ysleta border-crossings on city’s wish list,” www.borderreport.com, 8/31/2021.

