
COVID-19 Trade Impacts Dramatic at Nogales District Ports
In the first 4 months of 2020, exported commodities at Arizona's 6 border ports of entry dropped 14.5% and imports from Mexico declined 7.7%

Since 2016, trade data analysts were looking for reflections of impacts of executive orders, trade wars, and adjustments to a revamped NAFTA. [1] It was anticipated that 2020 might show some reductions in both exports to and imports from Mexico, but the latest statistics indicated changes beyond expectations. Undoubtedly, the COVID-19 pandemic significantly contributed to an overall decline in traded commodities between the U.S. and Mexico.
Exports and Imports Fall below 2016 Levels
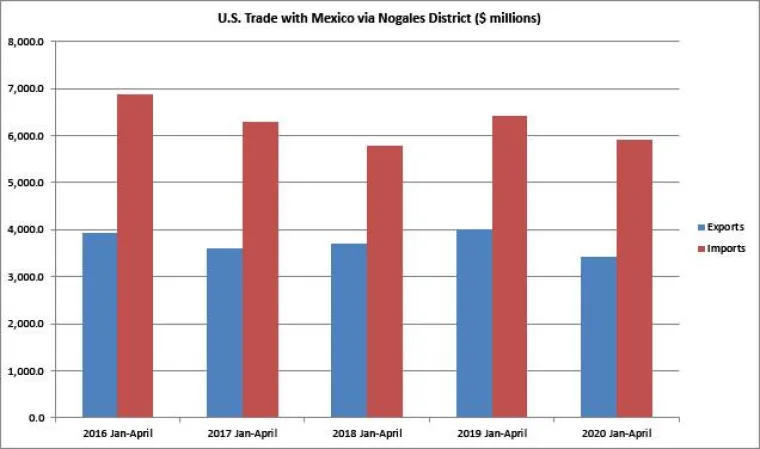
In the first four months of 2020, the Nogales District (comprised of six border ports of entry) facilitated $3.4 billion worth of exports and $5.9 billion worth of imports from Mexico. [2] In comparison with last year’s figures, the value of exported commodities dropped 14.5%, while imports from Mexico declined by 7.7%. Both exports and imports declined not only compared to a year ago, but fell even below the 2016 levels, as shown in Figure 1 . Four years ago in the same four-month period, the Nogales District facilitated $3.9 billion worth of U.S. exports to Mexico and $6.9 billion worth of U.S. imports from Mexico.
Figure 1. U.S. Trade with Mexico via Nogales District, January-April
April Data Evidence Unprecedented Declines in Trade
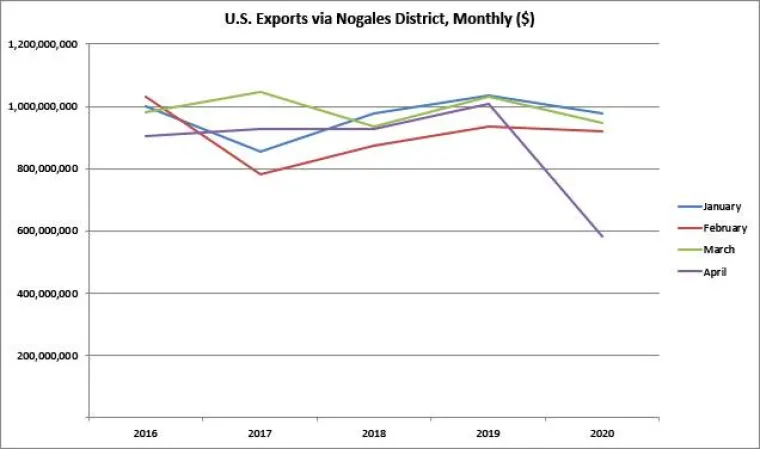
While fluctuations on a monthly basis are a common pattern in trade statistics, 42.2% drop from year ago, made April 2020 an obvious outlier, as shown in Figure 2 . All first three months in 2020 – January, February and March – experienced a decline in exports compared to 2019, but nothing was as dramatic as in April. Although it is difficult to pinpoint the single impact of COVID-19 pandemic, the extraordinary decline in exports to Mexico during month of April, undoubtedly suggest the impact of the closure of manufacturing facilities as one of strategies in efforts to contain the pandemic.
Figure 2. U.S. Exports through Nogales District, January-April ($)
Copper Ore Impacts on Total Value of Exports
One of the distinguished characteristics of the Nogales District is as the principal venue for exporting of copper ore to Mexico. Copper ore comprises one of the top exporting commodities through the Nogales District (mainly Nogales port of entry). Because it is very sensitive to global price fluctuations, in the end the value of exported copper ore substantially affects the overall value of exports through Nogales District. Figures 3 and 4 illustrate this point. First, Figure 3 shows monthly percent changes for all commodities, including copper ore. Substantial declines in January and February 2017 were caused by drop in copper prices.
Figure 3. U.S. Exports via Nogales District, incl. Copper Ore (% change year ago)
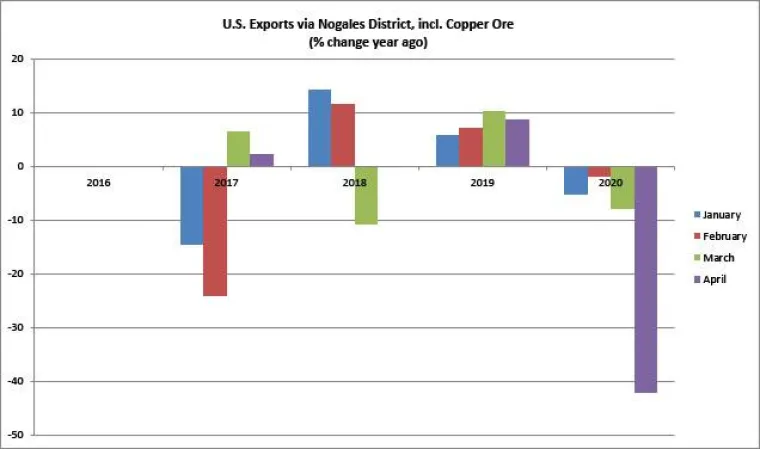
When copper ore is excluded from exports, as shown in Figure 4 , monthly percent changes rarely exceeded 10% range compared with year ago. Also, declines in total exports in February and March 2017 were much smaller when copper ore was excluded. On the other side, in 2019 and 2020, without copper ore, the exports of other commodities started showing near zero growth and even a decline. Finally, the April decline without copper ore reached close to 50% (compared to 42% when copper ore is included in total exported value).
April Imports Hit Even Harder Than Exports
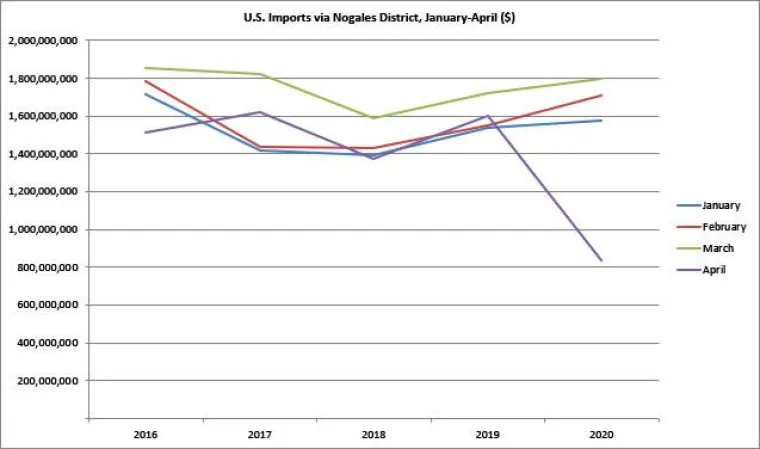
The total value of U.S. imported commodities from Mexico through the Nogales District in April declined 47.7% from a year ago, as shown in Figure 5.
Figure 5. U.S. Imports through Nogales District, January-April ($)
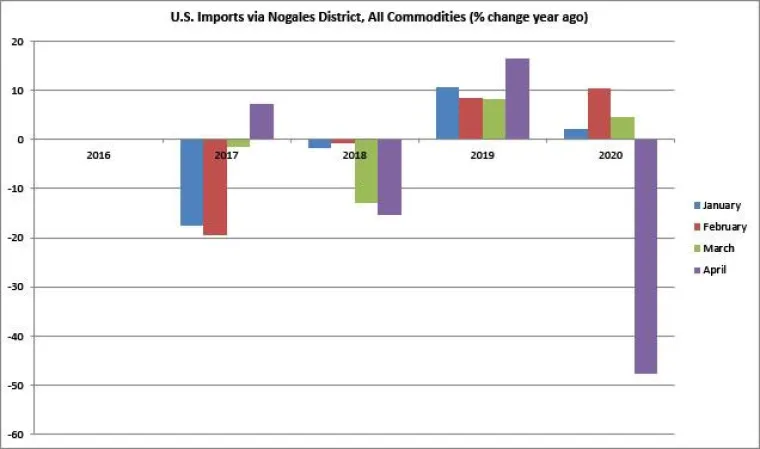
Here, fresh produce plays similar role in the total value of imports as does copper ore in exports. By comprising between 25% and 30% of the total value of imports through the Nogales District during winter season (running through April), fresh produce may offset decline experienced by other commodities . First, Figure 6 shows imports from Mexico including fresh produce. [3]
Figure 6. U.S. Imports via Nogales District, incl. Fresh Produce (% change year ago)
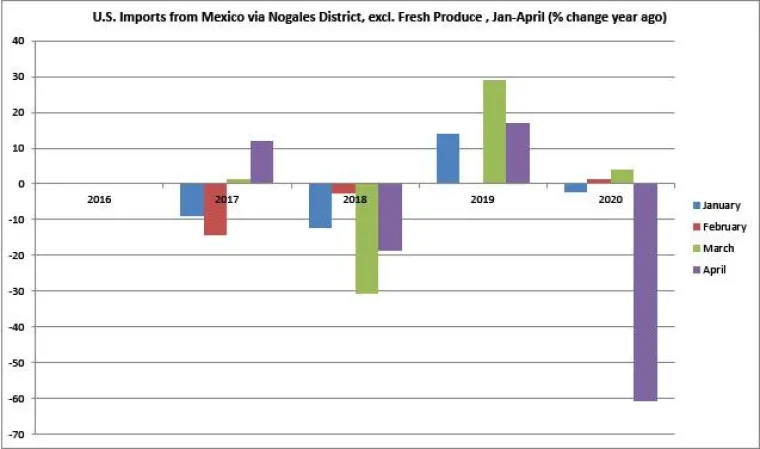
When fresh produce is excluded from total imports, as shown in Figure 7 , the April decline becomes a stunning drop of 60.7% from year ago.
Figure 7. U.S. Imports via Nogales District, excl. Fresh Produce (% change year ago)
Trade in Manufacturing Products Experience Deepest Declines
The closure of manufacturing facilities to curb the spread of COVID-19 caused considerable disruption in a well-established manufacturing supply chain between the United States and Mexico. The April data showed a staggering decline in both imports and exports of manufacturing products facilitated through the Nogales District
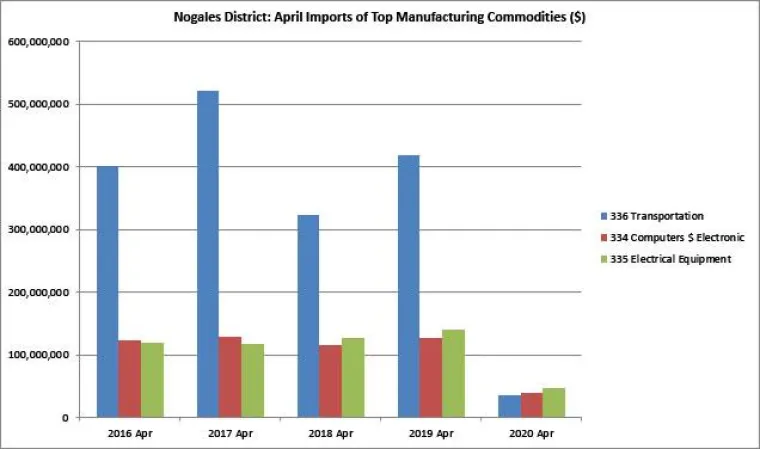
Figures 8 and 9 show the impacts on principal manufacturing products in cross-border trade between the U.S. and Mexico through the Nogales District. Among U.S. exports, as shown in Figure 8 , the most affected were electrical equipment (NAICS 335), computer and electronic equipment (NAICS 334), and transportation equipment (NAICS 336). The same three categories of manufacturing products comprise the top manufacturing imports from Mexico, reflecting a highly integrated manufacturing production. As shown in Figure 9 , the transportation sector experienced the hardest hit.
Figure 8. Top U.S. Manufacturing Exports to Mexico in April via Nogales District ($)
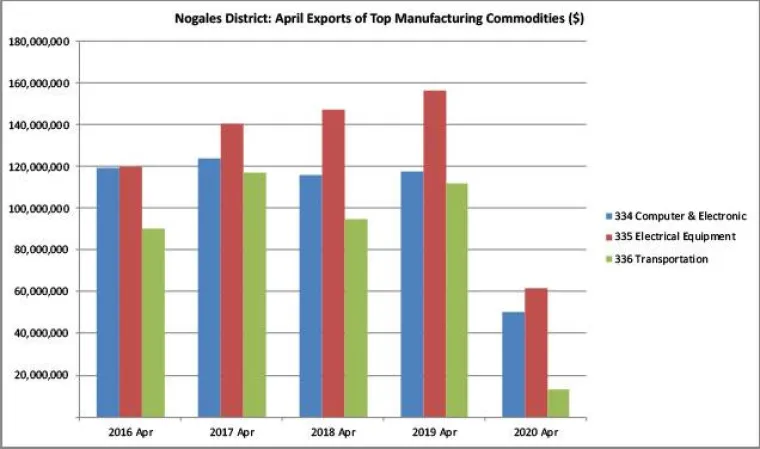
Figure 9. Top Manufacturing Imports from Mexico in April via Nogales District ($)
Data source for all charts: USA Trade Online
Conclusion
While it is difficult to isolate the single impact of COVID-19 on cross-border trade between the U.S. and Mexico, it is certain that it had an extraordinary and never before seen impact, at least not since the original NAFTA was inaugurated As the economic activity in both countries slowly resumes, it is to be expected that cross-border trade will pick up, and that hopefully only this past April will be remembered as the worst month in any year. However, the recovery from damages caused by pandemic is taking place in an already changing economic landscape. No doubt, COVID-19 pandemic created rough waters for cross-border trade as the new trade agreement, USMCA, enters the scene.
[1] The USMCA was inaugurated on June 1, 2020.
[2] All data for this article come from USA Trade Online. https://usatrade.census.gov
[3] Data include other agricultural products at 3-digit NAICS level, i.e. 111NAICS, but fresh produce is the largest category.