
Nogales District and U.S. Trade with Mexico: Between Unthinkable and Probable
Mexico is Arizona’s number one trading partner and thus a substantial part of the state’s economy is directly dependent on trade with Mexico
Even the slightest possibility that the border with Mexico might be closed for several hours, days, or indefinitely, has caused chills among not only residents and businesses near the international boundary, but practically every corner of the North American region would feel the ripple effect even if situated hundreds of miles away from the U.S.-Mexico international line. This is because the economies of the two countries have become highly integrated, especially in manufacturing industries through an intricate supply chain system. Arizona’s concerns stem from the fact that Mexico is Arizona’s number one trading partner and thus a substantial part of the state’s economy is directly dependent on trade with Mexico. In addition, Arizona’s border ports of entry provide import-export services to other states in trading with Mexico, and thus will feel ripple effects as other states adjust to disturbances.
Growing share of southern border districts in U.S. foreign trade
U.S. foreign trade is facilitated through 44 foreign trade districts encompassing 437 ports, where “merchandise clears Customs for entry consumption channels, bonded warehouses or Foreign Trade Zones” (1). Of those, four districts are along the southern border with Mexico: San Diego District in California, Nogales District in Arizona, and El Paso and Laredo districts in Texas. Together these four districts comprise 31 commercial ports, a majority of which are located along the international border, while several are located some distance away from the border, such as Tucson and Phoenix in the Nogales District. The four southern border districts include 7.1 percent of the total number of commercial ports, but process together 12.0 percent of all U.S. world trade, and 83.9 percent of U.S. trade with Mexico. As shown in Figure 1, U.S. trade with Mexico outpaced the growth rate of U.S. world trade since 2008.
Figure 1. U.S. Trade Growth with the World and Mexico since 2008 (2008=100)
One of the busiest international borders
In 2018, the U.S. exported to Mexico $265.4 billion and imported from Mexico $346.1.billion worth of products (2). Eighty-one percent of U.S. exports (or $213.7 billion) to Mexico and 87.3 percent of imports (or $302.0 billion) was shipped across the land border (3). Combined, imports and exports through four southern border districts reached a staggering $515.8 billion. On an average day this amounts to more than $1.4 billion worth of goods shipped in both directions. On an average day, more than 17,000 trucks, 31 freight train, 450 buses, and more than 210,000 personal vehicles cross the border from Mexico into the U.S., and approximately the same number crosses the border from the U.S. side southbound (4). On the same average day, close to 400,000 people cross the border in personal vehicles, another 5,000 cross the border as bus passengers, while more than 126,000 cross the border on foot. Again, the number of crossings doubles when the southbound crossings are taken into account. These statistics label the U.S.-Mexico border as one of the busiest international land borders in terms of volume of goods, number of vehicles, and people that cross the line in both directions.
Manufacturing products dominate U.S.-Mexico trade
Since the introduction of NAFTA in 1994, the composition of imports and exports by industry became more similar. NAFTA sanctified the ongoing “production sharing” based on differential labor costs and opened up unprecedented integration of North American manufacturing. As a result, a large portion of U.S.-Mexico trade in manufacturing products takes place between companies in the same sector as materials, components, and assembled products cross the border in both directions.
In 2018, four out of top five U.S. exports to Mexico included manufacturing products of four industries (in NAICS classification): Computer and electronic products (334), Transportation equipment (336), Machinery, except electrical (333), and Electrical equipment, appliances and components (335), accounting together for 50.8 percent of all U.S. exports to Mexico facilitated through southern border districts, shown in Figure 2.
Figure 2. Top U.S. Exports to Mexico through Southern Border Districts (2018)
As seen in Figure 3, U.S. imports from Mexico in 2018 resemble the same basic composition by industry identified in exports: Transportation equipment, Computer and electronic products, Electrical equipment, appliances and components, and Machinery, except electrical. These four manufacturing industries accounted for 72.8 percent of total imports from Mexico.
Figure 3. Top U.S. Imports from Mexico through Southern Border Districts (2018)
Laredo District leads in U.S. trade with Mexico
More than a half of all U.S. trade with Mexico in 2018, 51.7 percent, has been facilitated through Laredo District in Texas. El Paso District follows with distant 16.9 percent, San Diego District with 10.7 percent, and Nogales District with 4.6 percent. As shown in Figure 4, San Diego and Nogales districts appear to have lost a few points, while El Paso District gained a few by 2018, but in general, not much has changed in terms of rankings nor shares, since 2008. Exports and imports through other districts, including by air and sea, accounted for 16.1 percent in 2018, a decrease from 22.9 percent share in 2008.
Figure 4. Southern Border Districts Share of U.S. Trade with Mexico
U.S. exports to Mexico: Nogales District differs from the rest
In 2018, a total of $11.2 billion worth of U.S. products was exported to Mexico through Nogales district. Whereas four out of the top five NAICS categories were the same as seen in the data for all border districts, Nogales District displays a certain degree of specialization, as illustrated in Figure 5.
The top export commodities are Electrical equipment, appliance and components (NAICS 335) accounting for 15.8 percent of all exports (ranked in fourth place with 8.0 percent share in data for all border districts). Computer and electronic products (334), and Transportation equipment (336), which are ranked first and second in total exports of all border districts, but comprise the second and third places in Nogales District. Nogales District is also distinguished by the dollar value of exported Minerals and ores (212), in fourth place with 9.8 percent share, but not in the top five of all U.S. exports to Mexico. Machinery products (333), which are the third category by value in U.S. exports to Mexico through all border districts, take fifth place in exports through Nogales District.
Figure 5. Nogales District: Top 5 U.S. Exports to Mexico (2018)
U.S. imports from Mexico: Nogales District specialized in transportation equipment and agricultural products
In 2018, the U.S. imported $16.8 billion worth of products from Mexico through Nogales District. Two NAICS categories accounted for almost half of the total value: Transportation equipment (336) comprising 28.0 percent, and Agricultural products (111) with 19.4 percent, as shown in Figure 6.
In comparison, Laredo District’s top import category includes transportation equipment accounting for a full 42.0 percent of all imports from Mexico; computer and electronic products follow with distant 12.3 percent. Computer and electronic products dominate imports through El Paso District accounting for 42.6 percent of all imports from Mexico; transportation equipment is in second place with 25.7 percent. In the case of San Diego District, close to half of all imports are comprised of the two top categories, a pattern similar to Nogales District. However, unlike Nogales District, San Diego District’s top imports from Mexico include computer and electronics products, and transportation products.
Figure 6. Nogales District: Top 5 U.S. Imports from Mexico (2018)
Nogales District: composition of U.S. imports unchanged since 2008
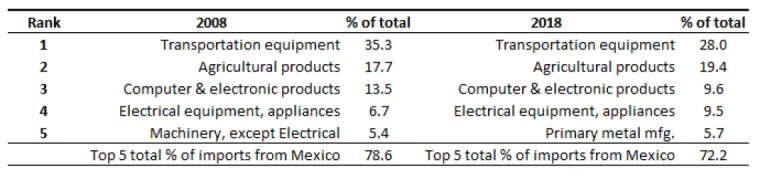
The basic composition of imported commodities through Nogales District has remained unchanged in the last ten years, as shown in Table 1. Transportation equipment and agricultural products have remained dominant import products, followed by computer and electronic products, and electrical equipment, appliances and components. By 2018, however, primary metal products replaced machinery products in the fifth position.
Table 1. Top 5 U.S. Imports from Mexico through Nogales District, 2008 and 2018 Comparison (ranked by dollar value)
Conclusion: Sensitivity of Nogales District to changes in import tariffs
The fact that the top two imports consist of transportation equipment and agricultural products, makes Nogales District particularly sensitive to the recently announced and partially implemented changes by the U.S. government.
First, the USMCA (new NAFTA), if and when ratified, will affect the transportation sector, although it is not yet clear what the final impacts might be due to a complicated supply chain system (as explored in this April 2019 article).
Second, the U.S. Department of Commerce terminated the 2013 Suspension Agreement on Fresh Tomatoes from Mexico on May 7, 2019, and as a follow up announced a 17.56 percent import tariff on tomatoes. Knowing what tomatoes have traditionally meant for the Nogales produce industry, this certainly is a profound setback for the “King of tomatoes”. In the short run, U.S. consumers in the western and southwestern states may absorb the costs of higher priced tomatoes. The imposed tariffs could also reduce tomato production in Mexico, causing job losses on both sides of the border in the highly integrated cross-border produce industry.
Finally, a recent threat of tariffs on all goods entering the U.S. from Mexico in the name of national security, while temporarily revoked, nevertheless looms as a dark cloud over the border region. The U.S. Chamber of Commerce estimated state-by-state impacts of the imposition of tariffs: based on a total of $9.0 billion in 2018, Arizona’s imports from Mexico would add an additional cost of $452.1 million (at 5%) and $2.3 billion (at 25%) (5).
Notes
- Foreign Trade Division, U.S. Census Bureau, Washington, D.C., https://www.cenusu.gov/foreign-trade/schedules/d/dist.txt
- In this article, import data represent landed value of merchandise at first port of arrival and include added import charges to custom value (excluding import duties). Data from USA Trade Online https://usatrade.census.gov
- The remainder of traded goods between two countries were shipped by ocean or air. Source: USA Trade Online.
- Border crossings of trucks, cars, busses, trains, and people are officially recorded only for the northbound direction. Source: Border Trade Statistics
- Analysis of the state-by-state impact of new tariffs on Mexico, US Chamber of Commerce, https://www.uschamber.com, 6/5/2019. https://www.uschamber.com/press-release/analysis-the-state-state-impact-of-new-tariffs-mexico